Save 50% on a 3-month Digiday+ membership. Ends Dec 5.

Mobile ads are a moving target, so to speak.
To get a clear picture of mobile display ad performance, Celtra conducted a comprehensive audit of ads that ran on the Celtra AdCreator 4 platform. During Q2 of 2014, of the total requested mobile display ad impressions, 98 percent were Standard ad formats; 89 percent were made by smartphones and 11 percent by tablets.
As for device platforms, more than half (51 percent) were served on iOS, 47 percent on Android and 2 percent on other platforms. Nearly two-thirds (64 percent) were in-app, while the rest were served in Web browsers.
That’s the big picture. Digging deeper into the findings, we learn more about specific ad formats, how they perform in each vertical and, perhaps, what the future holds.
Smart video ads significantly outperformed other format types in unit engagement rate
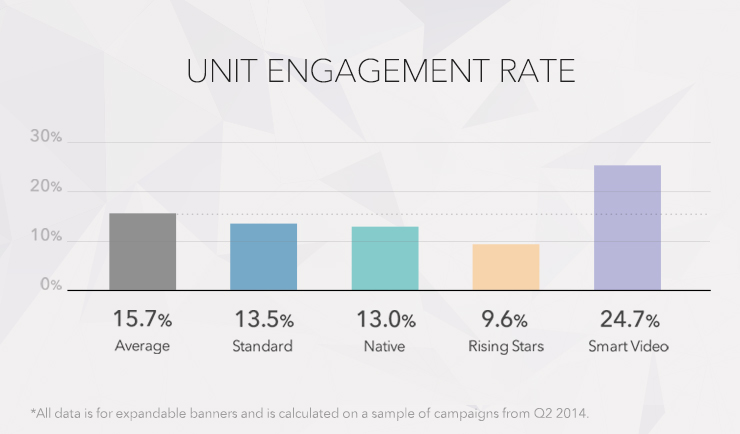
Specifically, Smart video ads engaged at nearly 64 percent above the average, and nearly double the engagement of Standard formats. Additionally, Smart video ads outperformed for time spent on ad unit: 27.1 seconds vs. Standard’s 16 seconds on tablets, and 24.8 seconds vs. Standard’s 16.1 seconds on smartphones.
Ad position: web_incontent_pos1
For both Standard and Smart video formats, ads placed within apps enjoyed higher expansion rates and time spent on ad unit in comparison to ads published in web browsers
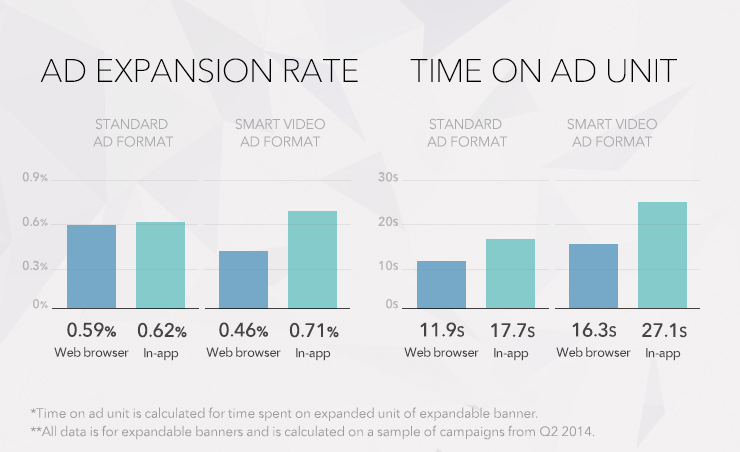
While in-app expansion rates are impressive leaders, their clear advantage lies in their time spent on ad units. Standard ads performed nearly 50 percent better in-app than in web browsers. For Smart video ads, it’s a full 66 percent better performance.
Ad position: web_incontent_pos2
At 0.79 percent, technology yielded the highest ad expansion rate in Q2
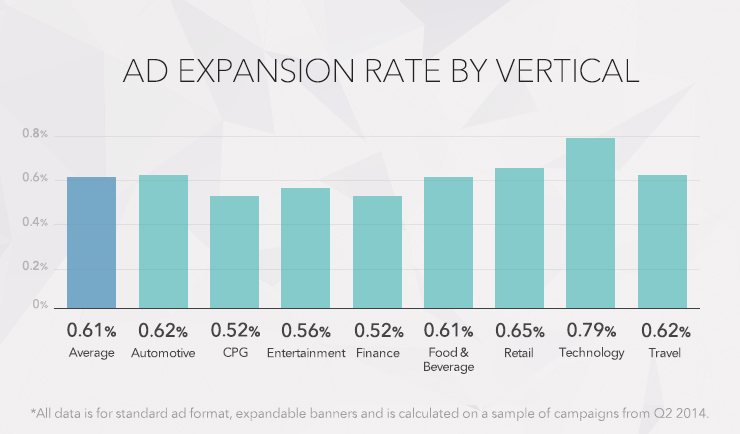
The least engaged verticals? Finance and CPG, each at 0.52 percent.
Automotive’s expanded banners boasted the longest time spent on ad unit, performing nearly 10 percent better in kind than the next vertical, technology
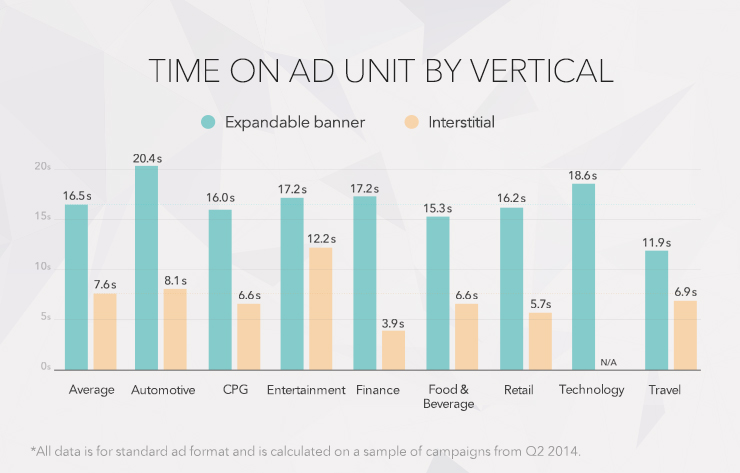
For interstitial ads, only entertainment showed a longer time on ad unit: 12.2 seconds compared to automotive’s 8.1 seconds.
The highest video completion rates were seen in the entertainment and travel verticals
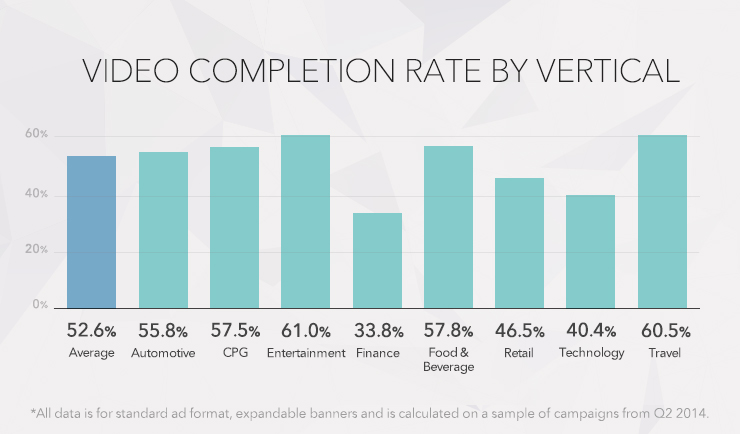
The worst performers? Finance (33.8 percent) and, curiously, technology (40.4 percent), which actually demonstrated the highest expansion rate this quarter (see above).
For more information on these and other important findings, click here.
![]()
More from Digiday
Testing Vendor Embed Script
Share this story Copy link Send this to your team LinkedIn X Facebook Email

What publishers are wishing for this holiday season: End AI scraping and determine AI-powered audience value
Publishers want a fair, structured, regulated AI environment and they also want to define what the next decade of audience metrics looks like.

Ulta, Best Buy and Adidas dominate AI holiday shopping mentions
The brands that are seeing the biggest boost from this shift in consumer behavior are some of the biggest retailers.
Ad position: web_bfu