Save 50% on a 3-month Digiday+ membership. Ends Dec 5.

Written by Ranvir Gujral, CEO, Chute.
Consumers’ attention spans are plummeting. In 2000, the average hovered around 12 seconds, just enough time for marketers to make an argument and draw in their audience. In 2013, that number sank to a mere 8 seconds. Let the chase begin.
Marketers are in luck, however: they have a tool in the form of visual content. Our brains process visuals 60,000 times faster than text. But marketing teams only have so much time and so many resources to create this content. Producing, distributing and managing all of the visuals necessary to keep up with the digital pace isn’t easy.
“We know that on some platforms, you could just click a button and create all sorts of banners,” said Freeman Setrana, digital marketing manager at Home Depot. “But we do everything manually in-house. That’s a time-consuming effort.”
To discover just how hard it is, Chute partnered with Digiday on the latest State of the Industry report. We surveyed 204 marketers at brands, agencies, retailers and publishers on the challenges and opportunities created by visual marketing.
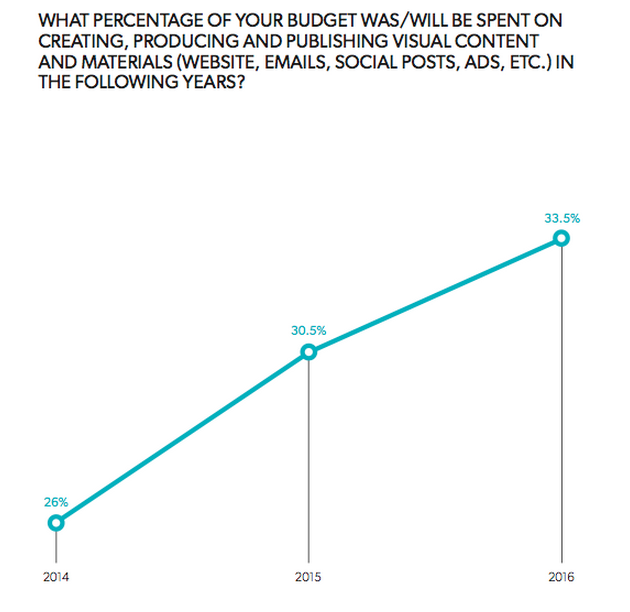
First things first: it should come as no surprise that visual marketing is on the rise. In the past year, the allocation of total marketing budget to the creation and distribution of visual content has grown from 26 to 30.5 percent, with similar growth projected for 2016. By then, visuals will consume more than one-third of total annual marketing budgets.
Ad position: web_incontent_pos1
This level of investment has to be founded on real faith in a visual approach to marketing. That’s just what 72 percent of marketers demonstrated when they said visual content is more effective than text content. In fact, in terms of key marketing performance metrics, they rated it 4.4 times more effective than its textual counterpart. Marketers with budgets lower than $5 million, who are likely more attuned to stretching a dollar to achieve the highest effectiveness, rate it even higher, saying it’s 5.1 times more effective.
But marketers have to contend with a broad swath of visual content competing for consumer attention. 78 percent recognize this glut of user-generated and entertainment content as a threat to their own efforts. “The reality is there are infinite options and limited time and attention,” said Steve Rubel, chief content strategist at Edelman. “You have to overcome that hurdle. There’s tremendous competition to click away from other types of content: not just things in your competitive set, but broadly speaking. Brands are facing that challenge.”
Content creation is a time-consuming and expensive task, but well worth it if done correctly. Time and again, brands have incorporated traditional visual assets such as stock and professional or commissioned photography. But while stock is most popular across paid channels, professional or commissioned work is most effective. The message? Despite the ease of sourcing stock photos, they’re the worst performing – with user-generated content performing about 65 percent better on desktop and 89 percent better on mobile. And while professional/commissioned photography is effective, it’s also extremely expensive and labor-intensive. UGC brings the best of both worlds, as authenticity and relevance are the preferred format of consumers today.
So how can marketers create effective visuals without spending too much time or effort? By automating and streamlining many of the processes.

Ad position: web_incontent_pos2
About 58 percent of marketers (and 76 percent of publishers involved with visual marketing) are eager for a way to automate, streamline or otherwise consolidate the many platforms they juggle to see their visuals come to life and reach their audiences.
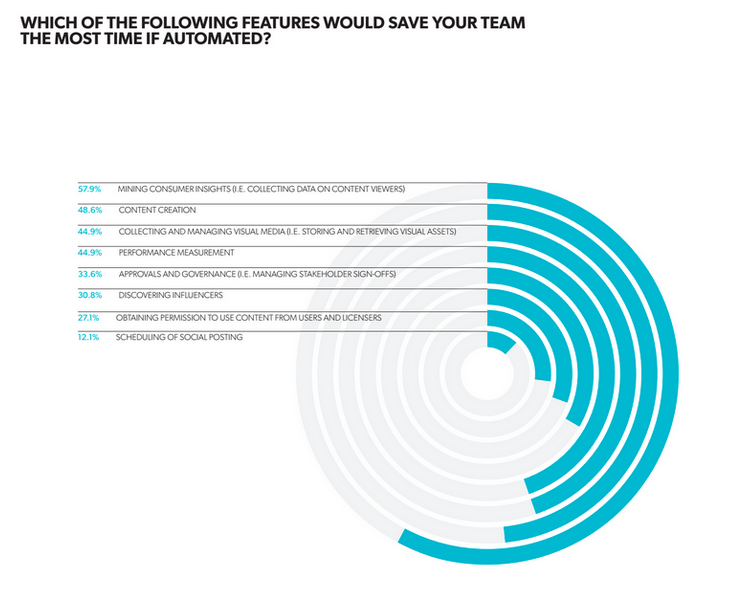
And respondents had a clear preference for the features that would save their teams the most time if automated — mining consumer insights (i.e. collecting data on content viewers) came in at number one.
In order for marketers to keep pace with their consumers’ eyeballs, they need to develop a strategy to embrace visual marketing automation. This starts from the top of the visual content funnel (the ability to dissect and gain insights from consumer, industry and competitive visual data) and goes all the way to the bottom: determining the best applications to manage that media in the most effective and economical ways possible.
Download the full Digiday/Chute report for more on:
- Which visual asset types work best on which platforms
- How much time is spent taking visuals from creation to performance measurement
- What market data is most essential to creating effective visual marketing
Join a live Chute webinar with Digiday Content Studio senior editor David Amrani and Chute CEO Ranvir Gujral as they take an in-depth look at the latest research around visual marketing on May 27, 2015 at 10 a.m. PST/1 p.m. EST.
More from Digiday

What publishers are wishing for this holiday season: End AI scraping and determine AI-powered audience value
Publishers want a fair, structured, regulated AI environment and they also want to define what the next decade of audience metrics looks like.

Ulta, Best Buy and Adidas dominate AI holiday shopping mentions
The brands that are seeing the biggest boost from this shift in consumer behavior are some of the biggest retailers.
Ad position: web_bfu

